


By Matt Vooro
This has been a very chilly spring in Canada. This marks a continued trend of cooling in the last few years likely related to the PDO. Snow even fell this June in the south central (photos from Calgary courtesy Madhav Khandekar).
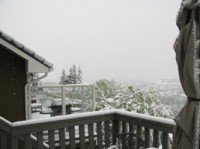
Lows this morning (courtesy of WSI) show the continued chill.
See larger image here.
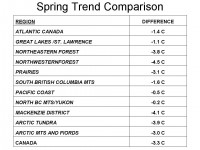
The trends since 2006, shows most of Canada has participated. The following shows Canada Spring Temperature Trend Comparison 2006-2009 Departures from 1948-2009 Trend.
See larger table here.
The difference is calculated using this Environment Canada Data Set as of June 10, 2009.
See pdf here. See Matt’s recap of the incredible Canadian winter here.
By Steve Goddard on Watts Up With That
For the third straight summer, the UK Met Office has forecast hot weather using their state of the art computer models. Summer 2007 and 2008 were complete washouts, ranking as two of the most miserable, rainy summers on record.

31 August 2007
Summer 2007 - a wet season
This summer looks set to have been the wettest since UK rainfall records began in 1914, Met Office figures revealed today
29 August 2008
Wet summer could end with a bang
Forecasters at the Met Office are predicting that that final day of the summer could end with heavy rain and thunderstorms affecting some parts of the country this weekend. Within the UK some local rainfall records have been broken, especially across parts of Northern Ireland and Scotland where flooding severely affected road and rail transport. Provisional rainfall figures show that Northern Ireland had its wettest August since 1914 .
The current summer isn’t looking much better. Here is the forecast from UK Weather Online.
Issued: 0900hrs Friday 5th June 2009
Do you want summer?
Duty forecaster: Simon Keeling & Captain Bob
If you’re requiring rain you’ll be in luck, if you’re wishing for summer, then perhaps don’t hold your breath!
It has now been 1,047 days since London made it to 30C. I admire the persistence of The Met Office in getting their global warming message across to the public. Perhaps their new 30 million UK pound computers will do better with their actual predictions?

Read more here.
By Joseph D’Aleo, CCM, AMS Fellow
Joseph Romm, George Soros’s bulldog at the alarmist climate fantasyland web blog called Climate Progress has a post (h/t Climate Depot) ”NOAA puts out “El Nino Watch, so record temperatures are coming and this will be the hottest decade on record”.
Based on the coming El Nino he hints at upcoming disappointment for climate realists with respect to arctic ice and warmer global temperatures for 2009 and for the decade. Of course he used the bogus NOAA temperatures which have taken the lead in being the most contaminated and exaggerated through station dropout globally, no adjustment for urbanization, a purposeful adjustment up of sea surface temperature warming (compare UNISYS with NOAA satellite), and bad siting (Anthony Watts has identified only 10% of the 948 United States stations meet government’s own standards for siting).
The result is nonsense press releases every month like a year ago in June when NOAA proclaimed it to be the 8th warmest June in 129 years with an anomaly of +0.5C, while the satellites that dont have these surface errors found it to be the 9th coldest in its 30 years of record keeping with an anomaly of -0.11C. This last month University of Alabama MSU global satellite data had an anomaly of just 0.043C. You can count on NOAA, which has become another Mother Goose to tell a different story when they announce the May global numbers with their bogus assessment. Romm who revels in fairy tales, will surely announce the NOAA results.

See larger image here.
THE REAL STORY
El Nino is coming on very much as it did last year at this time.
See larger image here.
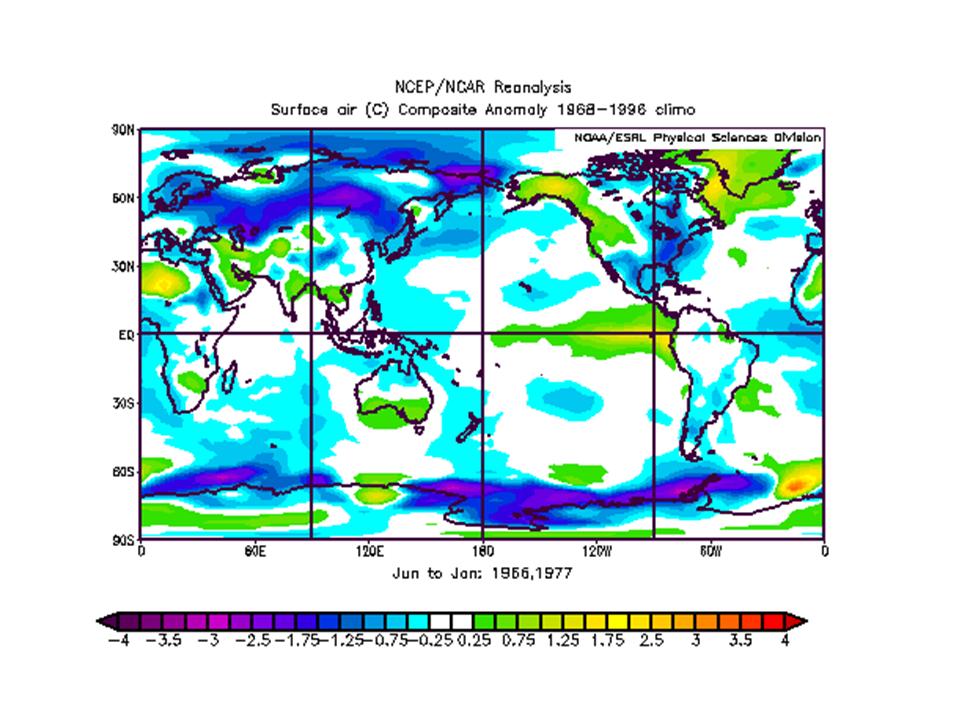
But Romm is ignoring it is doing so in a low solar and cool PDO era, with a cooling Atlantic and after a high latitude volcano, all of which project to a cool summer and a cold winter. The cold PDO usually also means a quick and brief El Nino. Years like 1965/66 and 1976/77 had similar conditions. The summer, fall and following winter composite average shown below. BTW, you won’t here mention of the PDO, ENSO is used only because they need it to explain year to year variability, admitting to the PDO would be game set and match for the alarmists as it would me admitting to a factor that explains the two decades of warming from 1979 to 1998, that was used to make CO2 the culprit.

See larger image here.
He is making the same mistake James Hansen and the UK met office made in early 2007 during a brief El Nino spike, predicted 2007 would be the warmest on record eclipsing 1998. It instead as El Nino gave way to La Nina had the most rapid cooling of the entire satellite record.
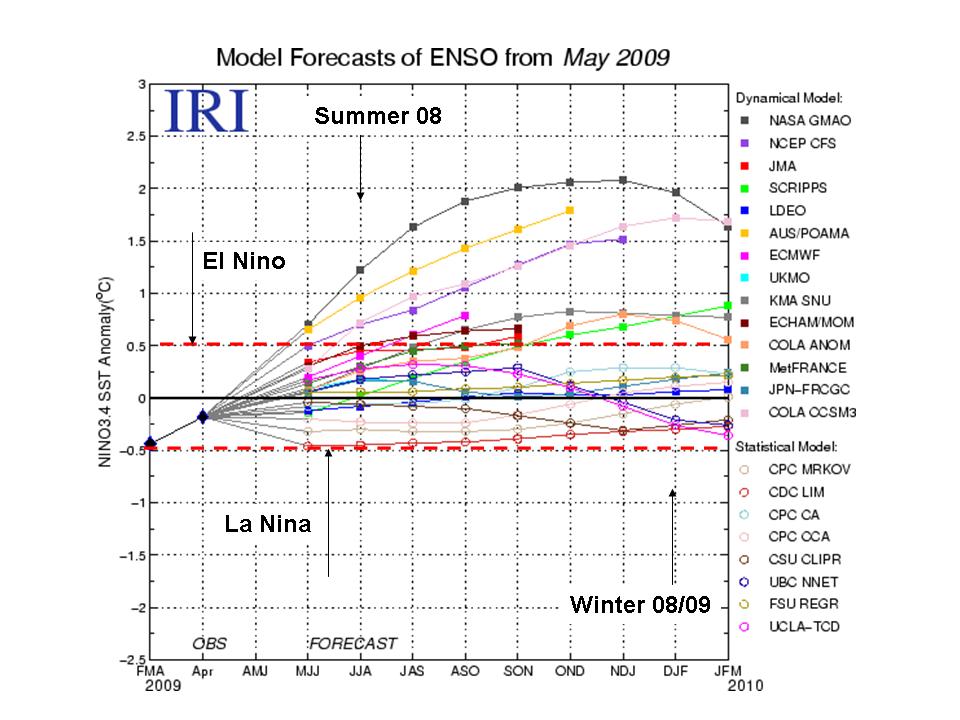
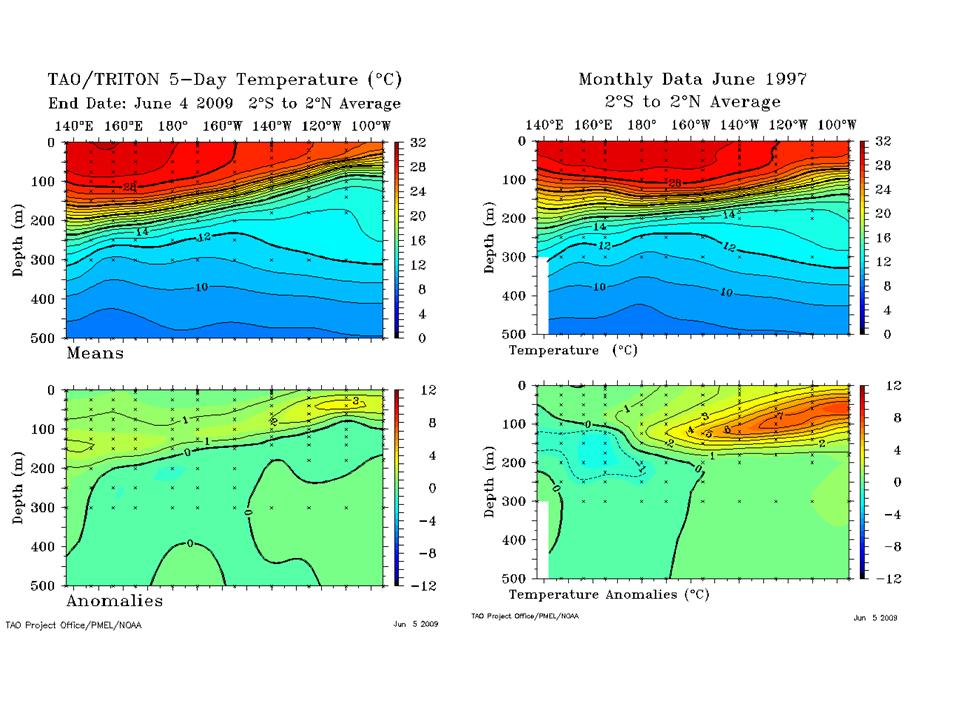
IRI has compiled the El Nino model forecasts and most forecast a transition through neutral (La Nada) and many to El Nino. Hansens NASA climate model is the warmest (must use the Hansen adjustment techniques). Lets look at some El Ninos using the TAO Triton cross-sections and see how they compare to this latest ocean water temperature pattern.
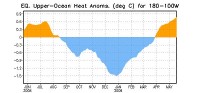
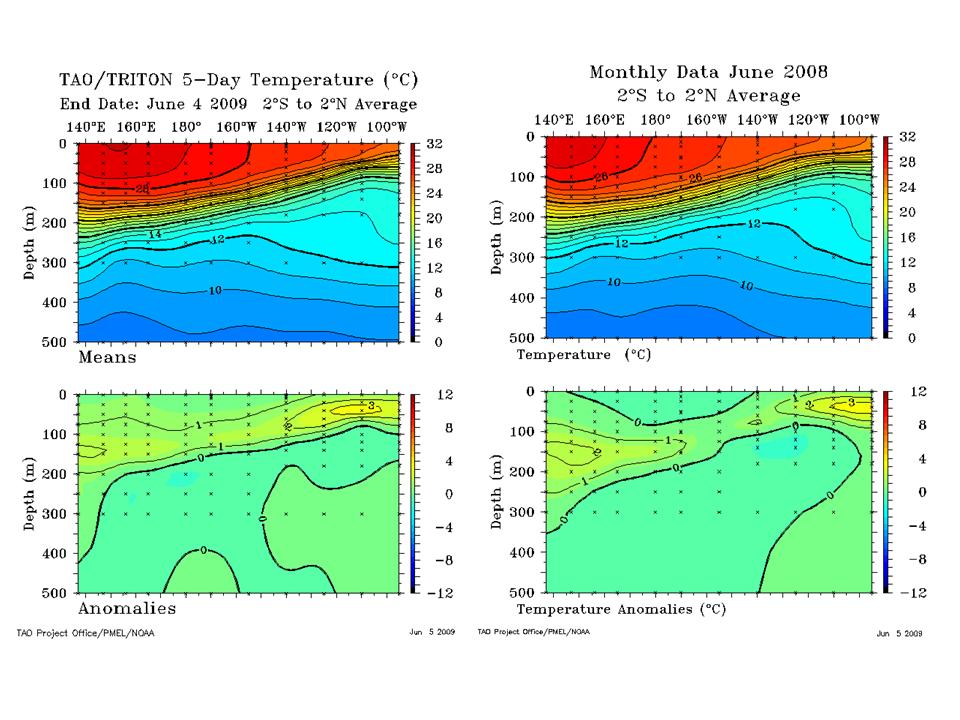
Last year showed a similar summer warming of the tropical Pacific that faded in the fall back to La Nina. Note the similarity in the ocean heat content to June of last year
See larger image here.
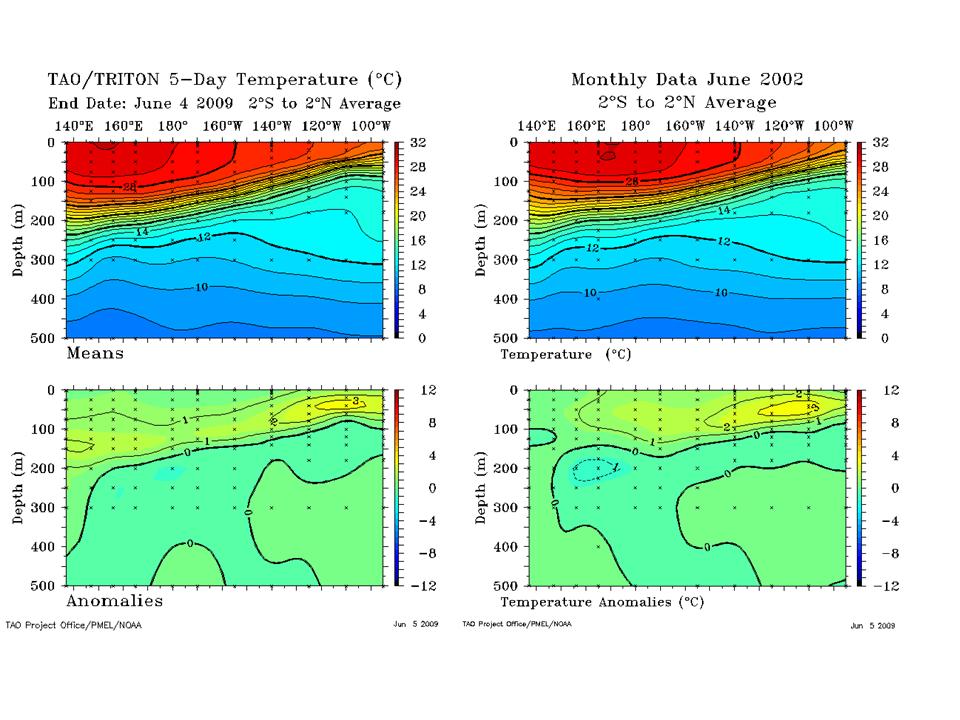
The last moderate El Nino in 2002 led to a very cold winter in the eastern United States with 6 months of below normal temperatures. It was very similar to this year in June.
See larger image here.
The ‘big-daddy’ El Nino of 1997 was much warmer underneath with a strong suppression of the thermocline. Anomalies of greater than +7C compare to the 1-2C anomalies this year. The PDO was in its warm mode in 1997 and the sun was coming back to life strongly both giving the ENSO a boost.
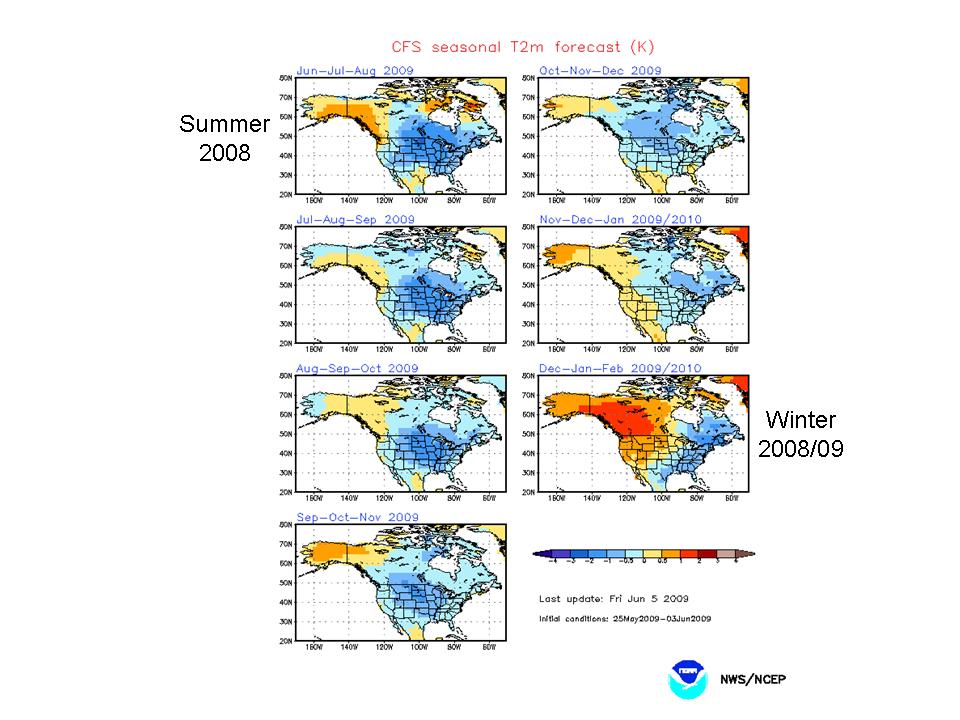
The CPC’s prize CFS climate model (Link here CFS.JPG) shows a cool summer, fall and eastern US winter not (winter not unlike 2002/03).
Time will tell (and maybe how much recovery in solar activity) whether we go back to normal or continue El Nino through the winter like 2002/03. La Ninas tend to dominate in low solar winters but El Ninos often pop when the solar activity bounces back.
In any event, it will be Romm who will be talking to himself when the year is over not the climate realists. Adventures in fantasyland can be so entertaining. Recall early this year when Romm lost a debate to Marc Morano who came to argue the science and Romm like most of his ilk simply deferred to authority (railroad engineer Pachauri’s own work of fiction and NOAA’s silly press releases) and went ad hominem, another favorite tactic of those whose science is bankrupt. See pdf with all images here.
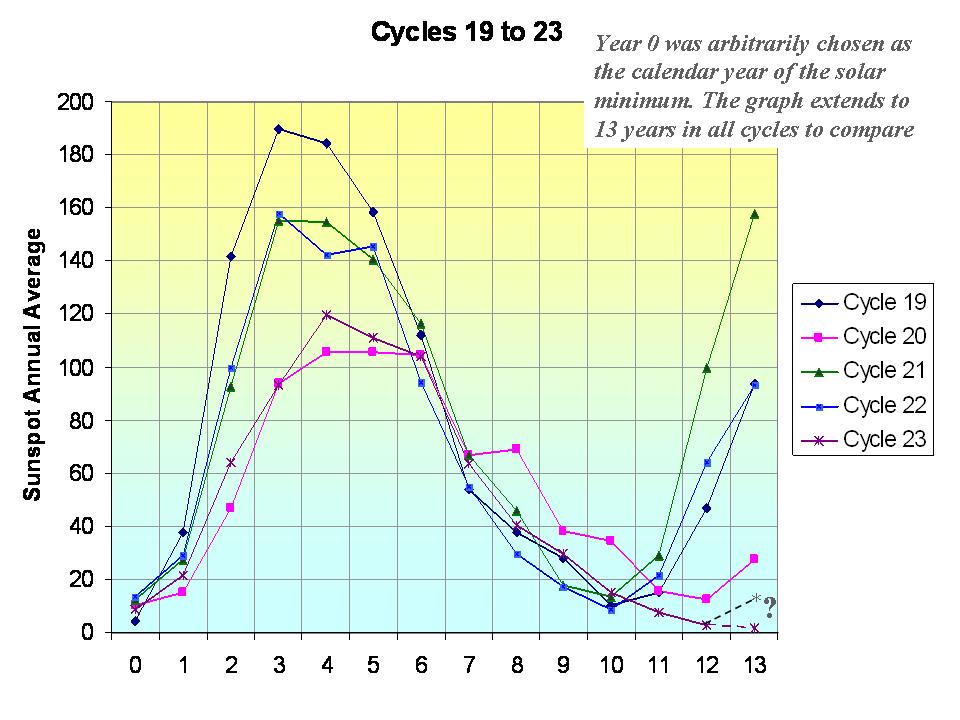
By Joseph D’Aleo
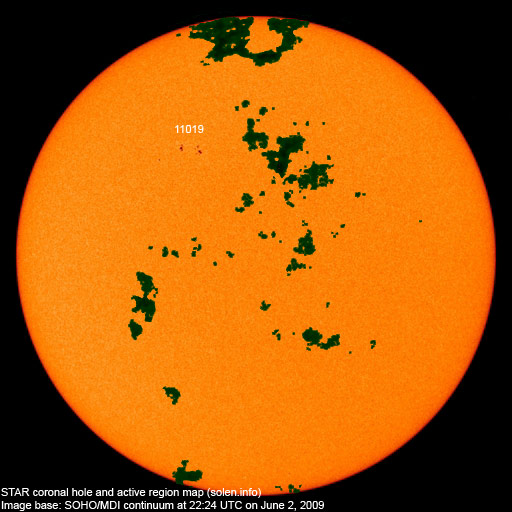
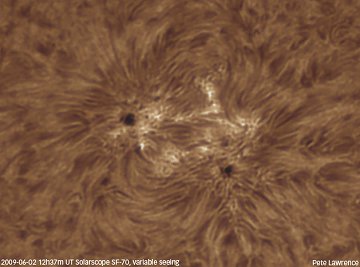
The sun has become more active in recent days with cycles 24 spots in middle latitudes. See sunspot group number 11019 for group of red spots. This is slightly diminished since yesterday. The dark green areas are coronal holes out of which the solar wind escapes at higher velocity.
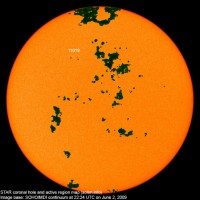
See larger image here.
Peter Lawrence has a close up view of that sunspot posted on spaceweather.com.

See larger image here.
There is a loop of the sunspots develop and rotate around the solar disk the last few days here.
This activity came late enough in the month of May, to keep the monthly number for May below the value of 14 months ago of 3.2 which it is replacing in the 13 month running mean. That means the solar cycle minimum cant be earlier than November 2008, making it at least a 12.5 year long cycle 23.
The value needs to fall below 3.4 in June to move the minimum to December. That is still possible if the sunspot group continues to decay as most have done as they crossed the disk in recent months. If it stays below that value, we will likely see the solar minimum in December, 2008 as 14 months before that the sun was very quiet with just a sunspot number of 0.5. If not, the minimum will be November. It is my guess that November will win the prize.
We added 22 more sunspotless days to the total for this cycle transition which as of June 1 had now reached an amazing 614 days. We are likely to add additional days and add 2009 to 2007 and 2008 as recent years in the top ten since 1900. Only the early 1900s had a similar 3 year stretch of high sunspot days (1911, 1912, and 1913).
See larger image here.
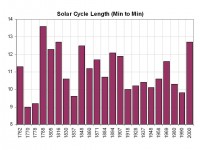
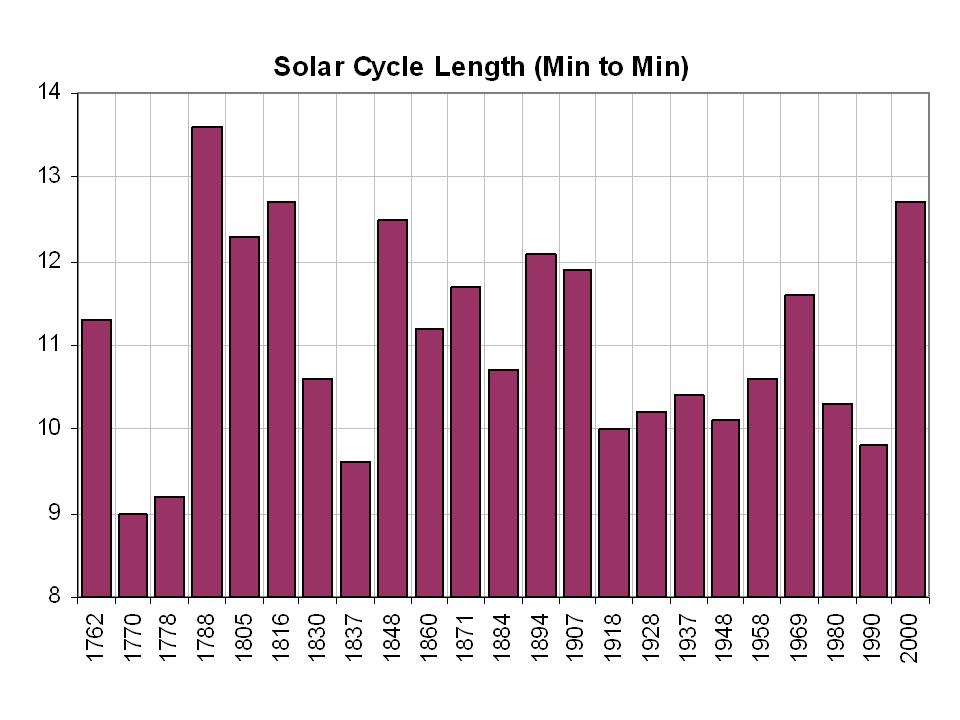
It also marks the longest cycle in 150 years, tying the one that peaked in 1848. You have to go back to the Dalton minimum in 1816 to find a longer cycle 12.7 years.

See larger image here.
You can see in 3 of the 5 most recent cycles, the sun had rebounded significantly by years 12 and 13 into the next cycle.
See what some scientists believe this means about the decades ahead here.
See also this story in DailyTech from NASA and this Icecap Library post on solar.
I am at the Third International Conference on Climate Change in DC with talks and meetings scheduled for tomorrow. I will post on results midweek. Meanwhile see this note to Dr. Benny Peiser of CCNet by Norm Kalmanovitch.
By Norm Kalmanovitch
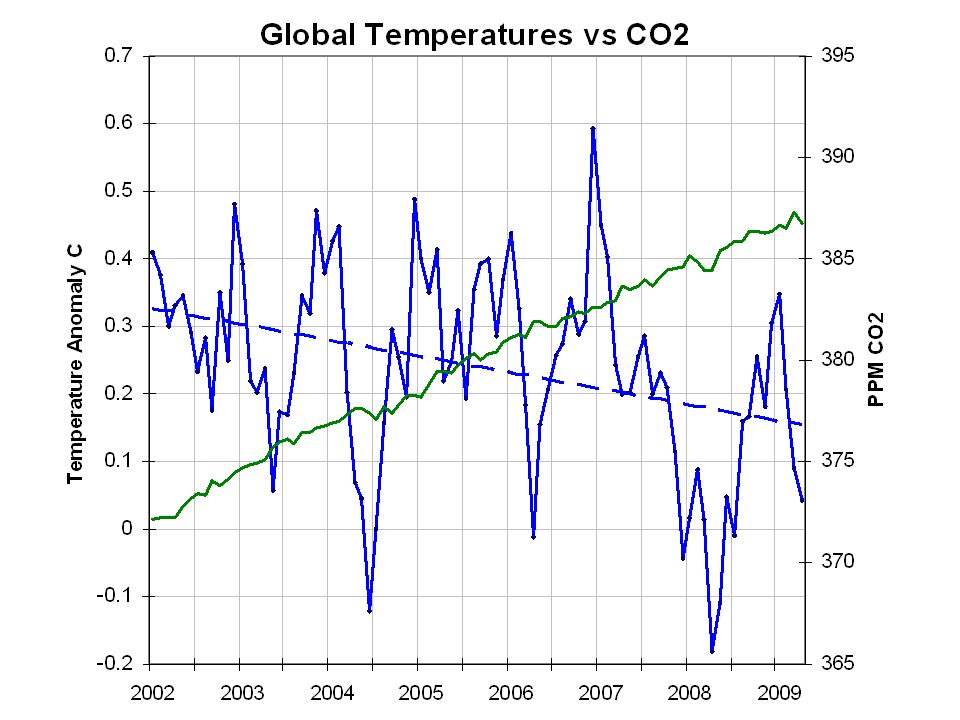
The measured global temperature record which started around 1856 shows that the Earth was in a warming cycle until around 1880. The CO2 record shows that CO2 was increasing by about 0.21ppmv/year over this period. During the cooling cycle which followed from 1880 to 1910, the CO2 concentration increased at a rate of about 0.30ppmv/year.
The next warming cycle from 1910 to 1942 saw a dramatic increase in global temperature, but the rate of increase in CO2 concentration only grew to 0.33ppmv over this time period. The well documented global cooling period from 1942 to 1975 that had the world concerned about an impending return to the equivalent of the Little Ice Age, had a contemporaneous rise in atmospheric CO2 that equated to 0.63ppmv/year; almost twice the increase in CO2 of the precious warming cycle.
During the warming that took place from 1975 to 1998, the rate of CO2 increase took another dramatic jump to 1.54ppmv/year, but this was followed by an increase to 1.91ppmv/year that we are currently experiencing during the present ongoing cooling cycle. Each successive cooling cycle has had an increase in the rate of CO2 growth over the previous warming cycle, indicating that there is no possible correlation of CO2 with global warming.
In 1988 Hansen et al published a paper “Global Climate Changes as Forecast by Goddard Institute for Space Studies Three-Dimensional Model” in the Journal of Geophysical Research that introduced a “CO2 forcing parameter”. This parameter had no actual physical basis, but was merely based on the assumption that a 100ppmv increase in CO2 was directly and primarily responsible for the measured increase in global temperature of 0.6C that had been observed over the past century.
This assumption ignored the fact that over this time period there was both cooling and warming concurrent with rising CO2 concentration, and considering that this paper was published just 13 years after a 33 year cooling trend that also had a concurrent increase in CO2 concentration there is no possible valid rational for this assumption. Essentially in the 46year period from 1942 to when the paper was published in 1988, there were 33 years of cooling and only 13 years of warming concurrent with increases in CO2, yet the models used a forcing parameter that directly related only warming to CO2 concentration increases.
With no basis in fact, this parameter is entirely a fabrication, and the projections of climate models that are based on this fabricated parameter are also meaningless fabrications. In addition to the fabrication, there is a bit of scientific fraud in the creation of this CO2 forcing parameter.
The Earth had been warming since the Little Ice Age at a rate of about 0.5C/century. The temperature value that went into determining the CO2 forcing parameter was 0.6C, with the difference from the 0.5C/century value likely due to the urban heat island effect. Even if this difference was directly due to CO2 increases, the difference between the observed temperature and the natural warming since the Little Ice Age is only 0.1C but the full 0.6C was used to fabricate the forcing parameter.
It seems that one fabrication leads to another, and when it became obvious that the natural warming of 0.5C/century since the Little Ice Age demonstrated the obvious deficiency in this forcing parameter of the climate models, the MBH98 temperature proxy also known as the “hockey stick” was fabricated to remove the Little Ice Age and allow the full 0.6C temperature increase to be related to CO2 increases. Considering that the climate models are the only support for the AGW premise, and the AGW premise is the only support for the climate models, exposing this simple fabrication is all that needs to be done to put an end to this circular argument that forms the basis for the entire climate change lunacy.
New Paper “Arctic Air Temperature Change Amplification”By Roger Pielke Sr. Climate Science
An excellent new paper is “in press” for Geophysical Research Letters (GRL) which documents the major role of regional atmospheric/ocean circulation pattern changes on regional multi-decadal climate variability (e.g. see What is the Importance to Climate of Heterogeneous Spatial Trends in Tropospheric Temperatures?).
This paper supports the finding that long term variations in atmospheric/ocean circulations (such as the Atlantic Multidecadal Oscillation, the Pacific Decadal Oscillation, ENSO, etc) cause regional changes in temperatures over this time period, and that these changes have a significant natural cause. Such a perspective supports the views of Joe D’Aleo (see) and Bill Gray (see) and Roy Spencer (e.g. see).
The paper is: Chylek Petr, Chris K. Folland, Glen Lesins, Manvendra K. Dubeys, and Muyin Wang: 2009: “Arctic air temperature change amplification and the Atlantic Multidecadal Oscillation”. Geophysical Research Letters (in press).
The abstract reads
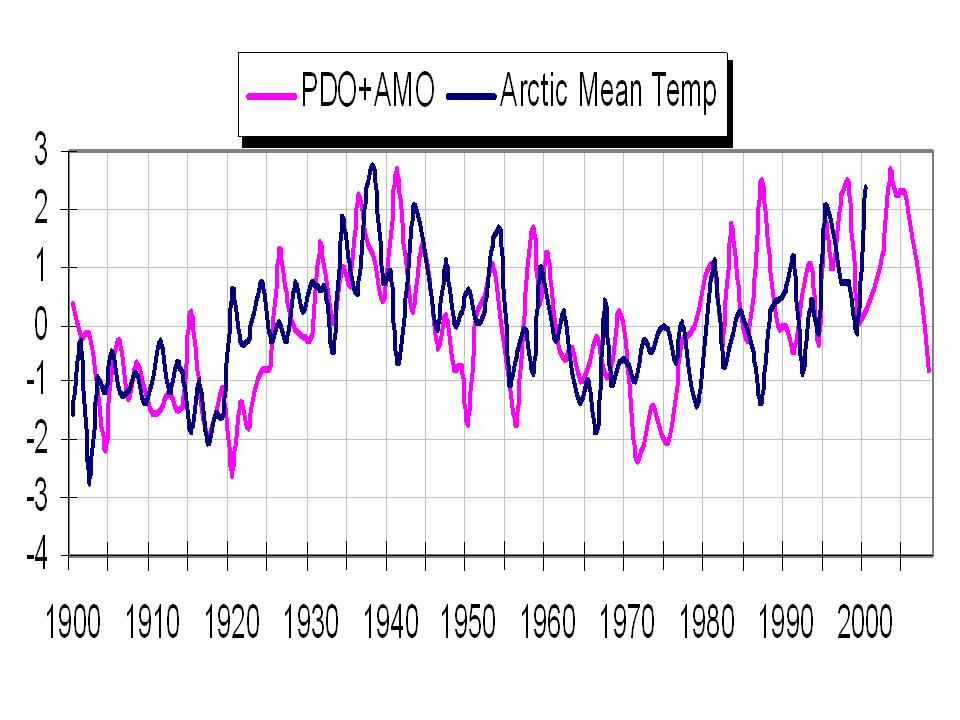
“Understanding Arctic temperature variability is essential for assessing possible future melting of the Greenland ice sheet, Arctic sea ice and Arctic permafrost. Temperature trend reversals in 1940 and 1970 separate two Arctic warming periods (1910-1940 and 1970-2008) by a significant 1940-1970 cooling period. Analyzing temperature records of the Arctic meteorological stations we find that (a) the Arctic amplification (ratio of the Arctic to global temperature trends) is not a constant but varies in time on a multi-decadal time scale, (b) the Arctic warming from 1910-1940 proceeded at a significantly faster rate than the current 1970-2008 warming, and (c) the Arctic temperature changes are highly correlated with the Atlantic Multi-decadal Oscillation (AMO) suggesting the Atlantic Ocean thermohaline circulation is linked to the Arctic temperature variability on a multi decadal time scale.”
Text in this paper includes: “In the following analysis we confirm that the Arctic has indeed warmed during the 1970-2008 period by a factor of two to three faster than the global mean in agreement with model predictions but the reasons may not be entirely anthropogenic. We find that the ratio of the Arctic to global temperature change was much larger during the years 1910-1970.” “We consequently propose that the AMO is a major factor affecting inter-decadal variations of Arctic temperature and explaining [the] high value of the Arctic to global temperature trend ratio during the cooling period of 1940-1970.”
“Our analysis suggests that the ratio of the Arctic to global temperature change varies on [a] multi-decadal time scale. The commonly held assumption of a factor of 2-3 for the Arctic amplification has been valid only for the current warming period 1970-2008. The Arctic region did warm considerably faster during the 1910-1940 warming compared to the current 1970-2008 warming rate. During the cooling from 1940-1970 the Arctic amplification was extremely high, between 9 and 13. The Atlantic Ocean thermohaline circulation multi-decadal variability is suggested as a major cause of Arctic temperature variation. Further analyses of long coupled model runs will be critical to resolve the influence of the ocean thermohaline circulation and other natural climate variations on Arctic climate and to determine whether natural climate variability will make the Arctic more or less vulnerable to anthropogenic global warming.” See Roger’s full post here.
Icecap Note: What we found:

Larger image here.
By Roger Pielke, Jr., Prometheus
Over at Seed Magazine in a collection of views on “framing,” Penn State climatologist Michael Mann explains why it was necessary to misrepresent what the IPCC does on the cover of his co-authored book titled “Dire Predictions: Understanding Global Warming”:
Often, in our communication efforts, scientists are confronted with critical issues of language and framing. A case in point is a book I recently co-authored with Penn State colleague Lee Kump, called Dire Predictions: Understanding Global Warming. The purists among my colleagues would rightly point out that the potential future climate changes we describe, are, technically speaking, projections rather than predictions because the climate models are driven by hypothetical pathways of future fossil fuel burning (i.e. conceivable but not predicted futures). But Dire Projections doesn’t quite roll off the tongue. And it doesn’t convey; - in the common vernacular; - what the models indicate: Climate change could pose a very real threat to society and the environment. In this case, use of the more technically “correct” term is actually less likely to convey the key implications to a lay audience.

As one of those “purists” who would like to receive information that is technically “correct” I probably can read that book by its cover.
In contrast, in another commentary on framing at Seed, ASU science policy expert Clark Miller suggests an alternative, richer view of framing: Two competing models of framing exist. The first views framing as a tactical choice in communication. Spinning information to comport with culturally embedded narratives purportedly raises its credibility with target audiences. This model presumes an ignorant and uninformed public, with all the dangers that implies for democracy. I reject this model.
The second model views framing, instead, as how humans make sense of and give meaning to events in the world - the lens through which they interpret disparate observations, models, data, and evidence in light of their values. This model posits framing as an ineradicable element of reasoning, even in science, and a facility for rich, nuanced storytelling as a foundation for human community.
Both models recognize that humans structure their understanding of policy through narrative and story. Rather than exploiting this structure for political gain, however, the second model acknowledges that any specific policy frame is, at best, partial and incomplete. Any frame reflects only one way of looking at a policy problem, leaving out potentially critical pieces of knowledge and significance.
See post at Prometheus.
By Joseph D’Aleo
May has been frigid slowing the planting and emergence of the summer crops in Canada. Late freezes and even snows are still occurring regularly and can be expected the rest of the month.
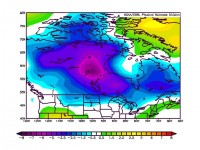
See larger image here.
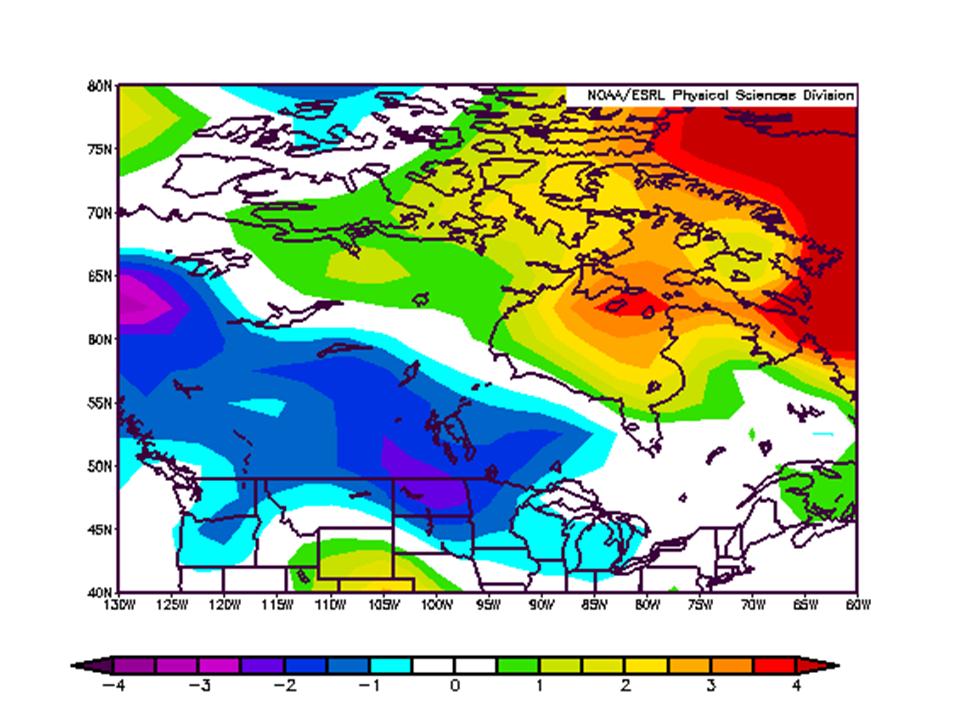
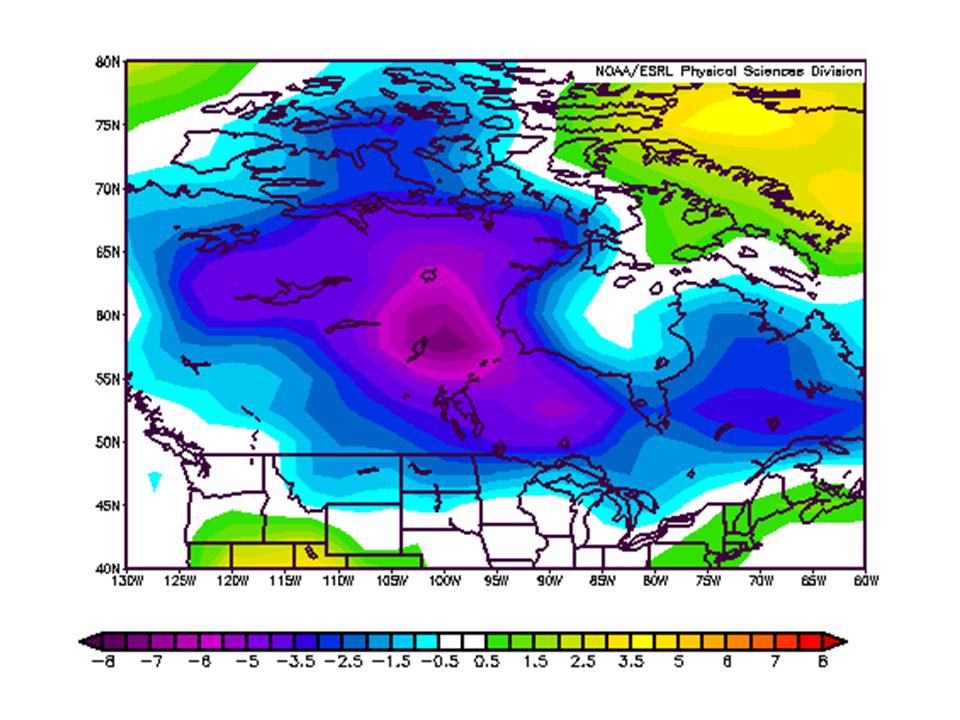
The chart above shows the May 2009 temperature anomaly through May 24th. Parts of central Canada (areas around Churchill, Manitoba) are running 12-16 degrees F below normal for the month through the 26th (map ends 24th). Every day this month has seen lows below freezing in Churchill and only 6 out of the first 26 days days had highs edge above freezing. The forecast the rest of the month is for more cold with even some snow today in Churchill and again this weekend perhaps further south.
Hudson Bay remains mostly frozen though most of the seasonal melting occurs in June and July most years.
Parts of the south central region were also cold in April averaging 3-5 F below normal. The winter (December to March) was a cold one for southwest and central Canada but warmer in the far northeast.
See larger image here.
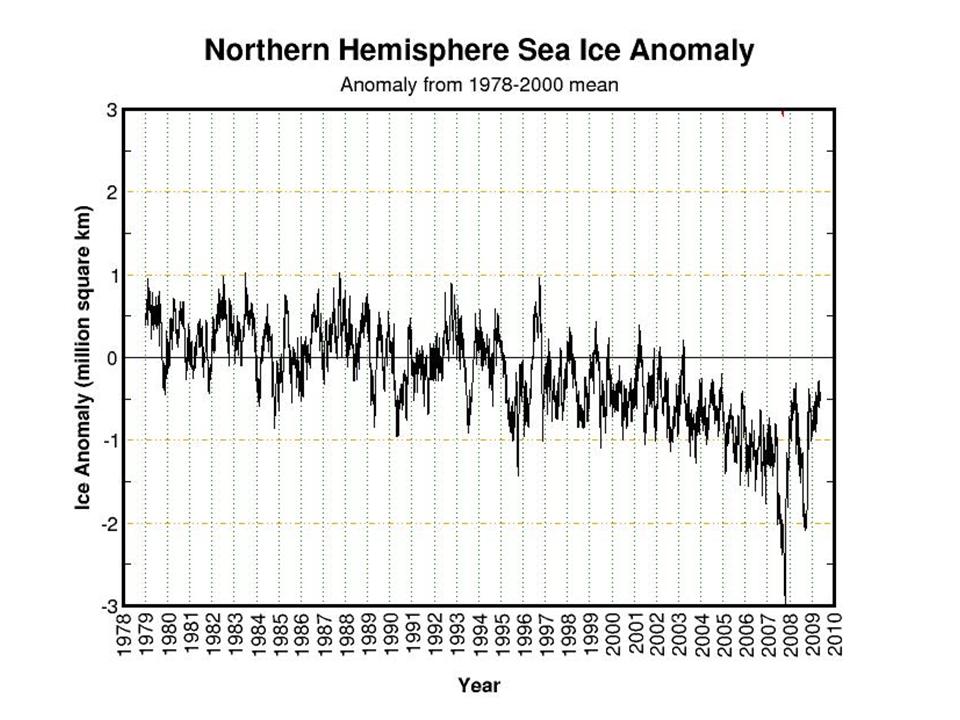
Meanwhile the arctic ice remains higher this data for any year this decade in a virtual tie with 2004.
See larger image here.
Given the polar stratospheric aerosols from Mt Redoubt, and a colder Atlantic and a continued cold Pacific, the recovery from the minimum of 2007 should continue this season.
The global data bases have large gaps in Canada, Africa, South America. So they will not reflect this in their global May anomalies as well as the satellites that see the entire surface - land and ocean excluding high latitude polar.
See pdf here. H/T Climate Depot and Andy for the heads up.
By Dr. Roy Spencer
Climate science took another step backward last week as a new study from the Massachusetts Institute of Technology was announced which claims global warming by 2100 will probably be twice as bad as the United Nations Intergovernmental Panel on Climate Change (IPCC) has predicted. The research team examined a range of possible climate scenarios which combined various estimates of the sensitivity of the climate system with a range of possible policy decisions to reduce greenhouse gas emissions which (presumably) cause global warming. Without policy action, the group’s model runs “indicate a median probability of surface warming of 5.2 degrees Celsius by 2100, with a 90% probability range of 3.5 to 7.4 degrees”.
Since that average rate of warming (about 0.5 deg. C per decade) is at least 2 times the observed rate of global-average surface temperature rise over the last 30 years, this would require our current spate of no warming to change into very dramatic and sustained warming in the near future. And the longer Mother Nature waits to comply with the MIT group’s demands, the more severe the warming will have to be to meet their projections.
Of course, as readers of this web site will know, the MIT results are totally dependent upon the climate sensitivity that was assumed in the climate model runs that formed the basis for their calculations. And climate modelers can get just about any level of warming they want by simply making a small change in the processes controlling climate sensitivity - especially cloud feedbacks - in those models.
So, since the sensitivity of the climate system is uncertain, these researchers followed the IPCC’s lead of using ‘statistical probability’ as a way of treating that uncertainty. But as I have mentioned before, the use of statistical probabilities in this context is inappropriate. There is a certain climate sensitivity that exists in the real climate system, and it is true that we do not know exactly what that sensitivity is. But this does not mean that our uncertainty over its sensitivity can be translated into some sort of statistical probability.
The use of statistical probabilities by the IPCC and the MIT group does two misleading things: (1) it implies scientific precision where none exists, and (2) it implies the climate systems response to any change is a “roll of the dice”. We know what the probability of rolling a pair of sixes with dice is, since it is a random event which, when repeated a sufficient number of times, will reveal that probability (1 in 36). But in contrast to this simple example, there is instead a particular climate sensitivity that exists out there in the real climate system. The endless fascination with playing computer games to figure out that climate sensitivity, in my opinion, ends up wasting a lot of time and money.
True, there are many scientists who really do think our tinkering with the climate system through our greenhouse gas emissions is like playing Russian roulette. But the climate system tinkers with itself all the time, and the climate has managed to remain stable. There are indeed internal, chaotic fluctuations in the climate system that might appear to be random, but their effect on the whole climate system are constrained to operate within a certain range. If the climate system really was that sensitive, it would have forced itself into oblivion long ago. The MIT research group pays lip service to relying on “peer-reviewed science”, but it looks like they treat peer-reviewed scientific publications as random events, too. If 99 papers have been published which claim the climate system is VERY sensitive, but only 1 paper has been published that says the climate system is NOT very sensitive, is there then a 99-in-100 (99%) chance that the climate system is very sensitive? NO. As has happened repeatedly in all scientific disciplines, it is often a single research paper that ends up overturning what scientists thought they knew about something.
In climate research, those 99 papers typically will all make the same assumptions, which then pretty much guarantees they will end up arriving at the same conclusions. So, those 99 papers do not constitute independent pieces of evidence. Instead, they might be better described as evidence that ‘group think’ still exists. It turns out that the belief in a sensitive climate is not because of the observational evidence, but in spite of it. You can start to learn more about the evidence for low climate sensitivity (negative feedbacks) here.
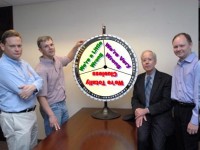
As the slightly-retouched photo of the MIT research group shown above suggests, I predict that it is only a matter of time before the climate community placing all its bets on the climate models is revealed to be a very bad gamble. See full blog here.
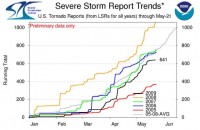
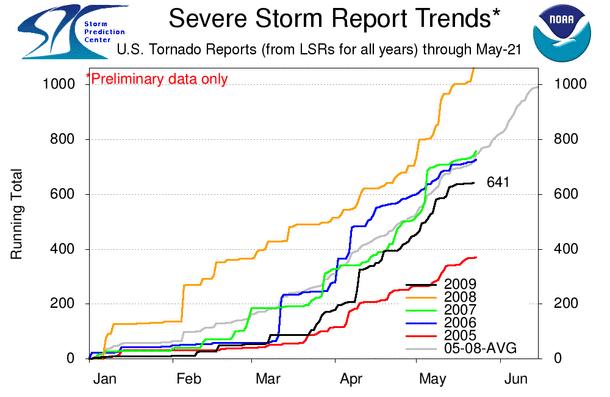
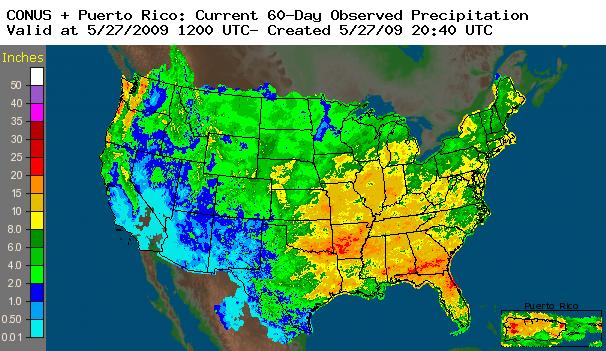
By Joseph D’Aleo on Intellicast
After another La Nina season with again a lot of snow and precipitation in the north central, another relatively active tornado season was expected and so far it has delivered on that promise. However given the La Nina was not as strong and the rebound in the Pacific towards El Nino is a month earlier than last year, the number of storms so far, have been less. It looks like May will fall well short of last May’s 461 tornadoes.
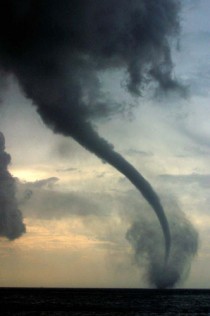
Cedar Hill, Texas, Photo credit Pat Skinner, TTU
The annual summary to date can be found here. The tornadoes so far in 2009 have been in the southeast quadrant of the nation. Climatologically, that is where the season normally begins.
See larger image here.
In 2008, the tornadoes when all was said and done, were found in all but 4 of the lower 48 states.
See larger image here.
As we move into summer, expect the activity to shift north with the jet stream. The march of the season - climatology of tornadoes normally follows this depiction (source here).
We are below the 5 year average for tornadoes for the season to date, below all but 2005.
See larger image here.
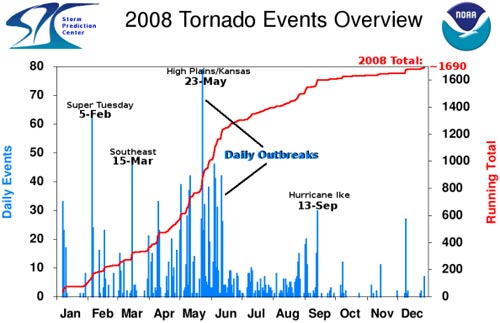
The activity was as usual concentrated in what is called tornado alley in the plains, Midwest to the Gulf. You can see in 2008 that the daily events peaked in May with the biggest day on the 23rd of May before falling off in summer as El Nino like conditions developed in the eastern Pacific. That is occurring a month earlier this year and perhaps, that explains the quieter May.
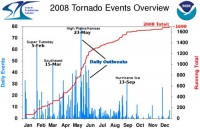
See larger image here.
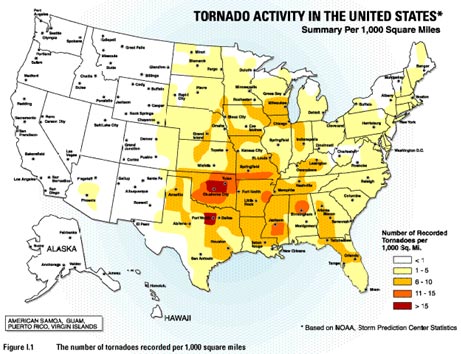
The activity was as usual concentrated in what is called tornado alley in the plains, Midwest to the Gulf.

See larger image here.
The reason that this region is most vulnerable is that this is where the combination of moisture from the Gulf of Mexico, dry air in mid levels from Mexico, a strong jet with cold air aloft coming out of the Rockies and a boundary between still cool air to the north and the warm humid summer like air in the south all come together. Read more and see some useful links here.
By the way, last year, the alarmist media blamed the increase in tornados on global warming. Well guess what this year, stormchasers across Tornado Alley have been frustrated this spring by what seems to be a lack of tornadoes and severe weather. Indeed, VORTEX2, the largest tornado field study ever, has been running for more than two weeks now and has not seen one twister. Last week, Weather Channel Senior Meteorologist Stu Ostro speculated that global warming was the cause. Of course this is the normal, mother nature has a perverse sense of humor - projects to study east coast storms had no east coast storms that winter, just one passing front. You just knew that VORTEX2 would lead to a lack of storms to study. We need them to schedule a massive study of hurricanes and we will surely have a dud season.
As to Stu’s reasoning, a big ridge would lead to heat and dryness across the central states. Instead the region has been hit hard with a steady stream of progressive troughs with heavy rainfall and very little warmth (fuel for storms). These storms brought more toirnadoes in April 2009 than in April 2008.
See larger image here.
The real issue may instead be that the El Nino like conditions that came in late May last year shutting off severe weather activity in June 2008 came on a month earlier this year and severe weather activity has diminished in May.
By Joseph D’Aleo
We have noted in the last year that NOAA has often become the warmest of the 5 major data sets in their monthly globval anomalies. Thanks to Bob Tisdale, we have a better idea why that is the case. Bob occasionally cross posts on Watts Up With That and gets a mention on Climate Audit, for newbies, these three sites should be among your favorite bookmarks.
Recent Differences Between GISS and NCDC SST Anomaly Data And A Look At The Multiple NCDC SST Datasets
By Bob Tisdale
In the recent WUWT post Something hinky this way comes: NCDC data starts diverging from GISS, the differences between GISS and NCDC global temperature anomaly data was discussed. I commented that the GISS and NCDC global surface temperature anomaly data relied on two different SST datasets.
NCDC has their own SST anomaly dataset for their global surface temperature product, and they calculate anomalies against the base years of 1901 to 2000. GISS has used the NCDC OI.v2 SST anomaly data since December 1981, and before that they had used the Hadley Centre’s HADSST data. GISS then splices the two datasets together. This post does not discuss the HADSST data, but delves into the differences between the multiple NCDC SST anomaly datasets, one of which is used by GISS.
GRAPHS OF GLOBAL OI.v2 (USED BY GISS) and “NCDC Ocean” SST ANOMALY DATA
I have not been able to find GISS SST anomaly data as a separate dataset, so for a short-term comparison, I’ll use their source, the OI.v2 SST anomaly data available through the NOAA NOMADS system. Unfortunately, the OI.v2 SST data uses a third climatology for their anomalies (with base years of 1971-2000), but don’t let that concern you. It just makes for an unusual comparative graph.
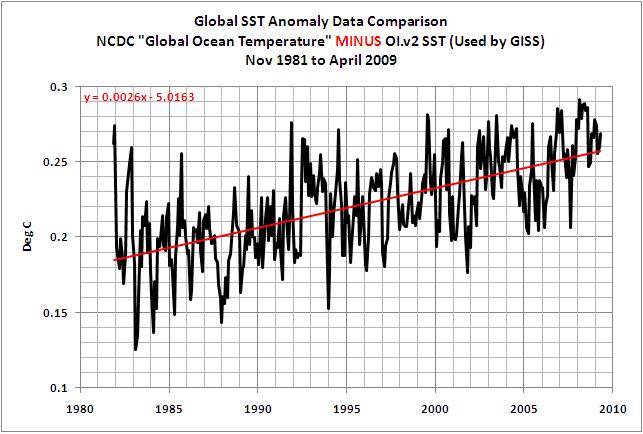
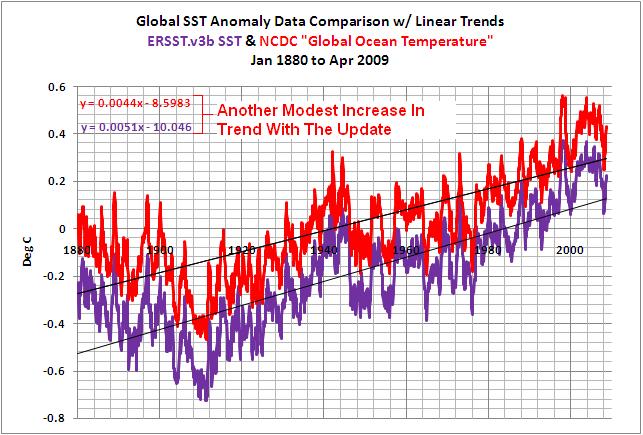
Figure 1 is a short-term comparison (November 1981 to April 2009) of the OI.v2 Global SST anomaly data (used by GISS) and the NCDC’s “Global Ocean Temperature”.
See larger image here.
The two datasets appear to track one another, and the obvious difference, the shift in the data, is a result of the different base years. But if we subtract the OI.v2 SST data from the NCDC “Global Ocean” SST anomaly data, we can see that one dataset rose more than the other since November 1981. Refer to Figure 2. The NCDC “Global Ocean” SST anomaly dataset rose at a greater rate than the OI.v2 SST anomaly data that’s used by GISS. This would bias the NCDC global surface temperature upward over this time span, or bias the GISS data down, depending on your point of view.

See larger image here.
Reynolds, Smith, and Liu gave the reasons for removing the satellite data from ERSST.v3 data as, “In the ERSST version 3 on this web page WE HAVE REMOVED SATELLITE DATA from ERSST and the merged product. The addition of satellite data caused problems for many of our users. Although, the satellite data were corrected with respect to the in situ data as described in reprint, there was a residual cold bias that remained. The bias was strongest in the middle and high latitude Southern Hemisphere where in situ data are sparse. THE RESIDAL BIAS LED TO A MODEST DECREASE IN THE GLOBAL WARMING TREND AND MODIFIED GLOBAL ANNUAL TEMPERATURE RANKINGS.”
See larger image here.
Hmmm. It looks as though, if you’re a SST data producer, downward biases are bad, but increases in trend with each update are good. See much more
detail and get data links here.
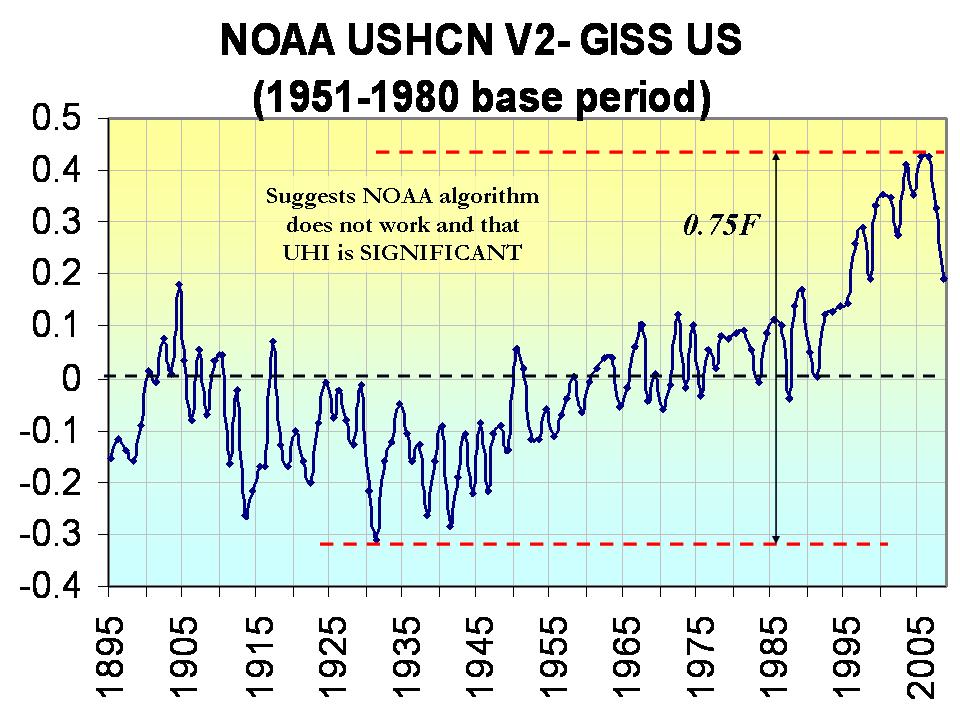
Icecap Note: NOAA and the other ground based data centers would have more credibility if one of the changes resulting in a reduction of the warming trend and not an exaggeration. Anthony Watts has clearly shown increasingly bad siting can lead to warm bias here. NOAA’s allowing 2/3rds of the world’s stations to dropout in 1990 led to more urban bias and thus warming, and NOAA has removed the US Urban Heat Island (UHI) adjustment and performs no UHI adjustment on global data. This is despite the facts that NCDC’s own Director Tom Karl in Kark et al (1988 J Climate) in Urbanization: its detection and effect in the United States climate record, showed the importance of urban adjustment and the Hadley Centre’s Phil Jones (2008) in Jones et al. ”Urbanization effects in large-scale temperature records, with an emphasis on China”, showed UHI’s contamination of data in China.
Removal of the UHI for the US resulted in a warming relative to GISS with UHI in the United States of 0.75F since 1940. Now having gotten all the warmth possible out of the land temperatures, they turn to the oceans, so promising as they cover 70% of the earth’s surface.

See larger image here.
By Dianna Cotter, Portland Civil Rights Examiner
In May 2006 we were told, with the most alarming language possible, that humans were causing the planet to warm with their use of Carbon based fuels. We must follow all of the recommendations of the IPCC report coming out in 2007 or humanity’s existence on earth would end. We were told that we must do something now, in order to prevent the deaths of untold millions, and the loss of humanity’s very ability to survive on earth. We must start taxing “Global warming Gasses” in order to stop their production, no matter the human cost! It’s a complete lie.
The IPCC - the International Panel on Climate Change is a committee with an agenda, and one it was pre-programmed to execute. It was designed from the outset, from its very beginnings to come up with a specific result. This is in direct contradiction to every principle of real science, the aim of which is to describe reality as it is, not reality as one wishes it to be.
To illustrate this, in 1995 the IPCC completely ignored Satellite evidence, very clear evidence, that there was no warming according to a report from the Heartland Institute Released in 2008. The full pdf is titled Nature, Not Human Activity, Rules the Climate . The institute claims, and is backed by anecdotal reports that the IPCC changed portions of the text of its report to make it appear that humans were the cause of the warming they artificially detected, or in other words, manufactured. Also attributed to the Heartland Institute’s report, the IPCC ignored further data confirming the lack of warming - if not showing a slight cooling - that became available after the May 2006 deadline.
The report the column speaks of is the NIPCC. The Nongovernmental International Panel on Climate Change. A completely independent examination of all the evidence available in published peer-reviewed literature. They included every single piece or evidence available to them, positive and negative, they did not select research that proved their predetermined result as the IPCC did. They went through everything. Their conclusion, there is no human caused global warming.
“The 1995 IPCC report was notorious for the significant alterations made to the text after it was approved by the scientists - in order to convey the impression of a human influence. The 2001 IPCC report claimed the twentieth century showed ‘unusual warming’ based on the now-discredited hockey-stick graph. The latest IPCC report, published in 2007, completely devaluates the climate contributions from changes in solar activity, which are likely to dominate any human influence”.
For anyone who has any sort of intellectual honesty at all, the report from the Heartland Institute is a MUST read. Dr. Fred S. Singer who conceived and directed the NIPCC project is an honored and decorated scientist. His Raison d’etre is truth, not political machinations, or power. He is deeply concerned by the absolute mis-use of science in what has now become a multi-billion dollar business, that is based on what amounts to a hoax.
“The Fourth Assessment Report of the IPCC [IPCC-AR4 200 “When new errors and outright falsehoods were observed in the initial drafts of AR4 (The Fourth Assessment Report of the IPCC [IPCC-AR4 2007]), SEPP [Science and Environmental Policy Project] set up a ‘Team B’ to produce an independent evaluation of the available scientific evidence. While the initial organization took place at a meeting in Milan in 2003, ‘Team B’ was activated only after the AR4 SPM appeared in February 2007. It changed its name to NIPCC and organized an international climate workshop in Vienna in April 2007.”
This group of scientists, who have looked at all available evidence, from satellite to very unreliable ground temperature readings to historical records, concludes correctly; if Human governments are going to be institution policies that will drastically affect the lives of its citizens, and the Waxman-Markey Cap and trade energy bill is without a doubt just that, then it must be utterly certain of the science that backs the supporting reasons for the existence of the legislation.
This report states unequivocally that there is zero evidence of man-made global warming. We are about to kill a Nation, literally for hot air that does not exist. Considering the likely ramifications of Waxman-Markey Cap and trade energy bill, indeed, we must have the fortitude to re-examine honestly all of the information available to us. For those of you who believe whole heartedly in Man-made Global warming, then these reports are a must read for you. They are peer reviewed documents based in fact. If you are supporting legislation that will wreck such economic devastation not only on your fellow Americans but also on yourself, it should be read so that you can counter those who do not believe in global warming caused by man. Because you will have some explaining to do. Be cautioned however, upon reading them, you will find yourself starting to realize that you have been had. Human caused Legislation like the Waxman-Markey Cap and trade energy bill will do more harm to more people in a year, than human caused Global Warming will in the next century. It is nothing short of a massive money stealing scheme made by our Governement to pay for the whorish excesses of the last 6 months. Now that is an inconvenient truth. Read more here. H/T Climate Depot.
By Ann McElhinney & Phelim McAleer
In the UK the media are getting very excited about wind power.
But as we discussed before environmental journalists seem to be little more than nodding dogs who endlessly believe and cheerlead everything they are told by activist groups.
Bringing truth to power seems to disappear when the power is a well funded environmental group. And so it is with wind power. Recently the BBC and Channel 4 have carried big excited stories about a planned new wind farm in UK. However neither felt it important to EVEN mention the little issue of “back up”. Both reports made much of the wind farm being able to power 180,000 homes which they stated could produce enough energy to power Glasgow.
But the nodding dogs are being dishonest and disingenuous. Wind will never power towns or cities on their own and giving that impression is both dangerous and misleading. We still need fossil fuels to keep us safe and the lights on as reported in this Reuters story. “Britain, which aims to install about 30 gigawatts (GW) of wind turbines by 2020, will need to build almost as much backup power generation for calm weather periods, an executive from Scottish Power said on Wednesday,” Reuters reported.
“Thirty gigawatts of wind maybe requires 25 GW of backup,” said Rupert Steele, regulation director at the Scottish arm of Spain’s Iberdrola, one of the world’s largest wind farm operators. “The problem is that if you’ve got a high-pressured area, you may have quite a large area where there’s no wind at all ... That happens also offshore,” he told Reuters.”

Environmentalists know this. Just ask them to send their child to a hospital whose system is fully dependent on wind power and watch them run in the other direction. They know that wind is erratic and will never supply the electricity that keeps our towns, cities factories, schools and hospitals running and all of us safe and healthy. But they don’t tell us this when they triumphantly pronounce that we can power the world with solar and wind. What is so much more disappointing is that so called ‘impartial’ reporters don’t tell us either.
Shame on you Channel 4 and BBC for not reporting this truth to your viewers.
See earlier story “The Answer My Friend is NOT Blowing in the Wind” here.
See Congresswoman Michele Bachmann (R-MN) in this Washington Observer Interview says its so well here.
See more about Ann and Phelim’s important Not Evil, Just Wrong project.
See in this UK register story, about another green favorite boondoggle, the electric car. The Politicians’ obsession with electric cars is a waste of time - and costing British science and research dearly. So says Richard Pike, head of the Royal Chemistry Society, in a hard-hitting contribution to Research Fortnight (pdf).
New York Times Editorial
The administration’s budget for the Energy Department raises a disturbing question. Is President Obama, who has pledged to restore science to its rightful place in decision making, now prepared to curtail the scientific analyses needed to determine whether a proposed nuclear waste repository at Yucca Mountain in Nevada would be safe to build?
It is no secret that the president and the Senate majority leader, Harry Reid, who hails from Nevada, want to close down the Yucca Mountain project, which excites intense opposition in the state. The administration has proposed a budget for fiscal year 2010 that would eliminate all money for further development of the site, and Mr. Reid has pronounced the project dead.
But the administration at least claimed that it would supply enough money for the Energy Department to complete the process of seeking a license from the Nuclear Regulatory Commission, if only to gain useful knowledge about nuclear waste disposal. Unfortunately, the budget released this month looks as if it will fall well short of the amount needed.
Money for the Yucca Mountain project, nearly all of which is used to support the licensing application, would fall from $288.4 million in 2009, the current year, to $196.8 million in 2010, a precipitous drop. And the agency intends to rely heavily on its own staff personnel rather than on more costly outside consultants from the national laboratories or private contractors. There is great danger that the department will lack the expertise needed to answer tough technical questions that emerge during the regulatory commission’s reviews.
These ramp-downs are occurring at the worst time. The regulatory commission is just beginning its licensing process, which is scheduled to take three to four years, and its relevant boards have ruled that at least eight intervenors can raise some 300 issues for technical challenges, an unusually high number. The cutbacks increase the odds that the agency will stumble in trying to justify a license - or that the hearings and evaluations won’t be completed within statutory deadlines.
Meanwhile, the administration, Congressional leaders and the nuclear industry are calling for a blue-ribbon panel to study alternative ways to dispose of nuclear waste. Surely it would be useful for any such panel to know whether the Yucca Mountain project was sound or flawed.
Before approving this truncated budget, Congress needs to ensure that it contains enough money to sustain a genuine licensing effort. We have no idea whether Yucca Mountain would be a suitable burial ground for nuclear wastes. But after the government has labored for more than two decades and spent almost $10 billion to get the site ready for licensing hearings, it would be foolish not to complete the process with a good-faith evaluation. Are Mr. Obama and Mr. Reid afraid of what the science might tell them? Read editorial here.
By Roger Pielke Sr., Climate Science
I have generally supported most EPA actions which have been designed to support environmental improvement. These regulations have resulted in much cleaner water and air quality over the past several decades; e.g. see National Research Council, 2003: Managing carbon monoxide pollution in meteorological and topographical problem areas. The National Academies Press, Washington, DC, 196 pp.
However, the EPA Endangerment Findings for CO2 as a climate forcing falls far outside of the boundary of the type of regulations that this agency should be seeking. The EPA on April 17, 2009 released this finding in ”Proposed Endangerment and Cause or Contribute Findings for Greenhouse Gases under the Clean Air Act”. This report is a clearly biased presentation of the science which continues to use the same reports (IPCC and CCSP) to promote a particular political viewpoint on climate (and energy policy).
“After a thorough examination of the scientific evidence on the causes and impacts of current and future climate change, as well as other effects of greenhouse gases, the Administrator concludes that the science compellingly supports a positive endangerment finding for both public health and welfare. In her decision, the Administrator relied heavily upon the major findings and conclusions from recent assessments of the U.S. Climate Change Science Program and the Intergovernmental Panel on Climate Change.” “The Administrator is proposing this endangerment finding after considering both observed and projected future effects of climate change, key uncertainties, and the full range of risks and impacts to public health and welfare occurring within the United States. The scientific evidence concerning risks and impacts occurring outside the United States, including risks and impacts that can affect people in the United States, provides further support for this proposed endangerment finding.”
What these statements tell us is that their finding includes results from multi-decadal climate predictions, which have never shown regional predictive skill, including any ability to predict past major weather events such as droughts! Nevertheless, they make claims with respect to the climate risks as if these are certain, despite the absence of skill in predicting them for the 20th century. They claim that
“The effects of climate change observed to date and projected to occur in the future include, but are not limited to, more frequent and intense heat waves, more severe wildfires, degraded air quality, more heavy downpours and flooding, increased drought, greater sea level rise, more intense storms, harm to water resources, harm to agriculture, and harm to wildlife and ecosystems. The Administrator considers these impacts to be effects on public health and welfare within the meaning of the Clean Air Act.”
In the document “Frequently Asked Questions on the Proposed Endangerment and Cause or Contribute Findings for Greenhouse Gases”, they have the Q&A. On what science was the proposed Endangerment Finding based?
“The Administrator relied heavily on existing, peer-reviewed scientific literature. In particular, she relied on reports and conclusions from the U.S. Climate Change Science Program, the National Research Council, and the Intergovernmental Panel on Climate Change because they represent the current state of knowledge on climate change science, vulnerabilities, and impacts. These studies are authored by leading scientific experts and underwent multiple layers of peer review, including, in many cases, review and acceptance by government agencies.”
As documented in Pielke Sr., Roger A., 2008: A Broader View of the Role of Humans in the Climate System is Required In the Assessment of Costs and Benefits of Effective Climate Policy. Written Testimony for the Subcommittee on Energy and Air Quality of the Committee on Energy and Commerce Hearing “Climate Change: Costs of Inaction” - Honorable Rick Boucher, Chairman. June 26, 2008, Washington, DC., 52 pp.; Pielke Sr., Roger A., 2005: Public Comment on CCSP Report ”Temperature Trends in the Lower Atmosphere: Steps for Understanding and Reconciling Differences”. 88 pp including appendices; and Protecting The IPCC Turf - There Are No Independent Climate Assessments Of The IPCC WG1 Report Funded And Sanctioned By The NSF, NASA Or The NRC.
The conflict of interest (with most of the same individuals leading the reports) is easy to see; i.e. the Federal (non-EPA) expert reviewers for the EPA Endangerment findings (see ”Technical Support Document for the Proposed Findings” are
Virginia Burkett, USGS; Phil DeCola; NASA (on detail to OSTP); William Emanuel, NASA; Anne Grambsch, EPA; Jerry Hatfield, USDA; Anthony Janetos; DOE Pacific Northwest National Laboratory; Linda Joyce, USDA Forest Service; Thomas Karl, NOAA; Michael McGeehin, CDC; Gavin Schmidt, NASA; Susan Solomon, NOAA; Thomas Wilbanks, DOE Oak Ridge National Laboratory.
In conclusion, the EPA Endangerment findings is the culmination of a several year effort for a small group of climate scientists and others to use their positions as lead authors on the IPCC, CCSP and NRC reports to promote a political agenda. Now that their efforts have reached the federal policy decision level, Climate Science urges that there be an independent commission of climate scientists who can evaluate the assement process that led to the EPA findings as well as the climate science upon which it is constructed. Read full comments here.